Using HappyFeat
Visualizing & analyzing features (central panel)
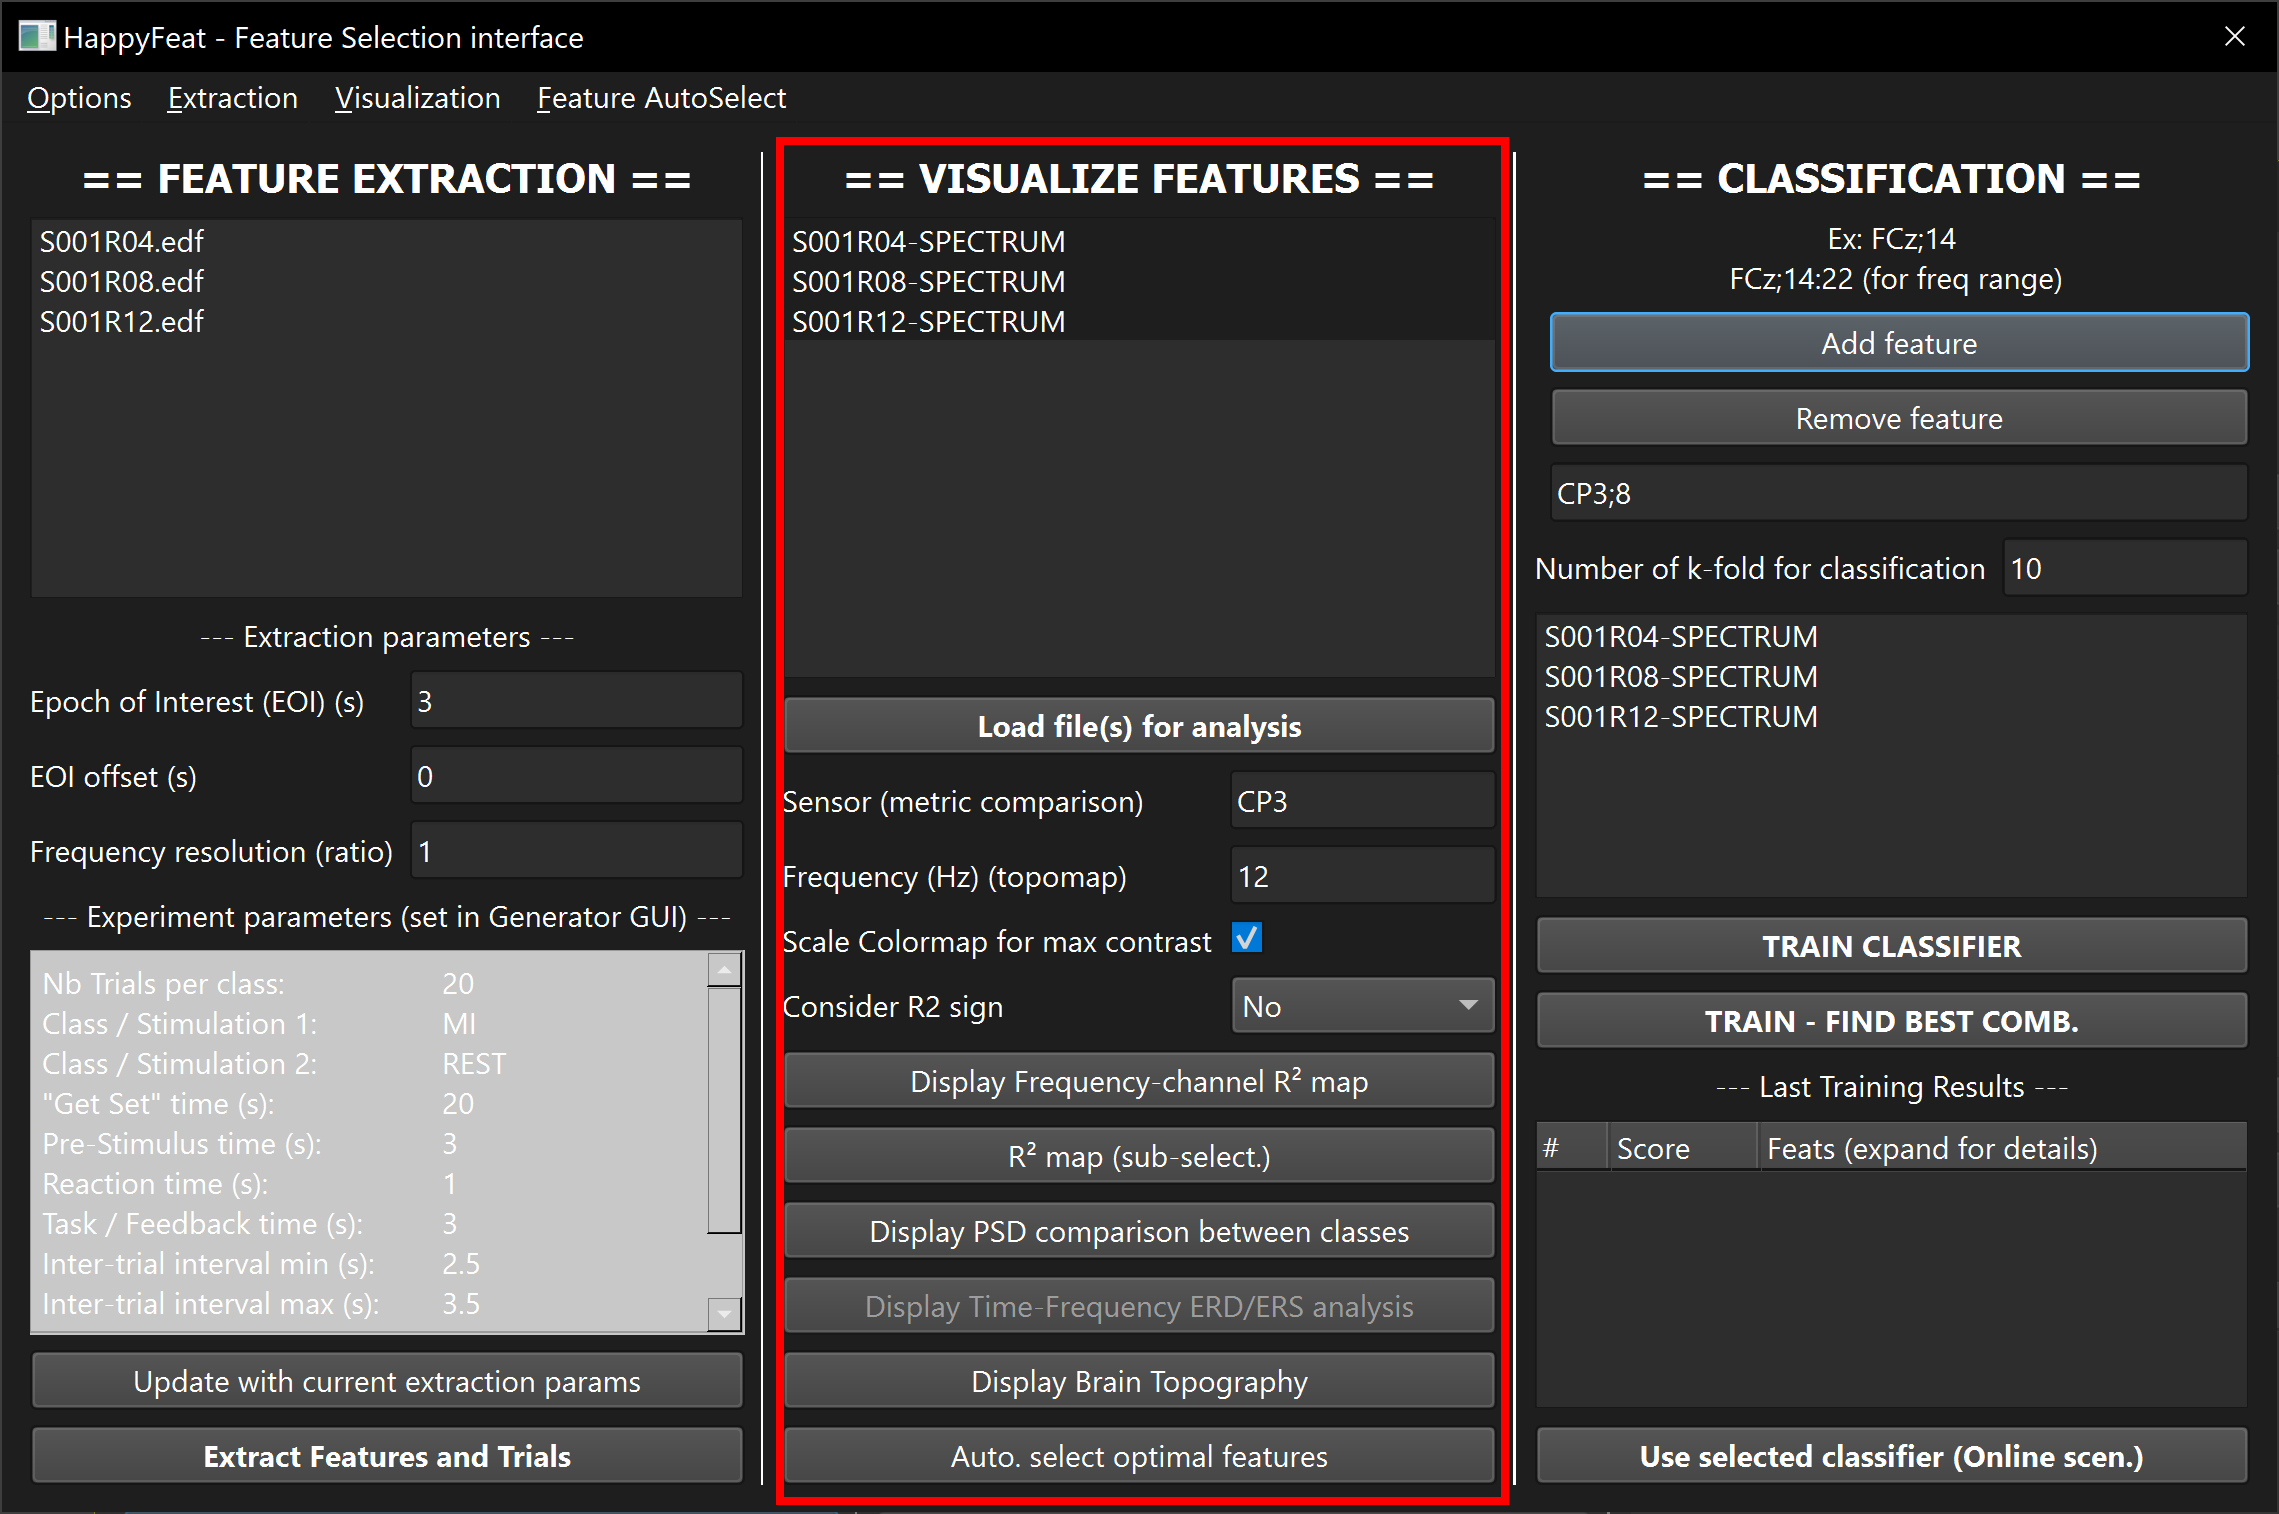
This step allows to visualize spectral features in multiple ways, in order to help selecting sensors and frequency bands of interest.
The top list of this panel is updated with signals/runs which have undergone feature extraction, using the current set of extraction parameters (see paragraph on sessions in workspaces)
In this list, select the runs you wish to analyze. When multiple runs are selected, all trials from those runs will be accumulated when computing the different statistics.
Click on Load file(s) for analysis
Use the buttons to display the plots you need, and the parameter fields to adapt the visualizations.
Tip
You can display as many visualization windows as needed, with different parameters.
Frequency/Channels R² contrast map
(Interactive - uses plotly, opens in a browser window)
This figure shows the the discriminant power of the extracted metric between the two classes, in terms of R2, over all trials of selected files.
Red squares are channel/frequency combinations with the best discriminant power.

R² as a scalp topographic map
(Static - uses matplotlib, opens in a Qt6 window)
This figure shows the projected topographic map of R2 values between the two classes, for a selected frequency.

Direct comparison of metrics
(Interactive - uses plotly, opens in a browser window)
This figure shows the values of the extracted metric for each class, plus the R² value, accross frequencies, for a selected sensor/channel.

Time/frequency ERD/ERS analysis
description coming soon...
Note on sensor montages
Warning
The R² map and R² topography are able to display an orderer list of channels and their locations thanks to the montage (standardized or custom) provided by the user when setting up the experimental parameters. They both start by comparing the signals' metadata with the provided sensor list (in both custom and standard montages). Displayed channels are the ones present in both lists. Mismatching or missing channels will not be displayed!
Automatic feature selection
See dedicated page.